Menu
Menu

Managing people has been a challenging task for decades, but the current trend in the use of data and analytics across various fields is transforming the way it evolves. HR is no exception to this shift. Incorporating metrics into your organization to track employee performance and productivity is closely tied to the overall revenue of the organization. According to the Society for Human Resource Management, only thirty-seven percent of HR leaders are currently using data to address people management-related issues.
One significant advantage of leveraging data in HR is that it enables organizations to gain a competitive edge and stay ahead in the industry. Furthermore, understanding and effectively utilizing these metrics can lead to more informed decision-making and better resource allocation. While many may have heard of various HR metrics, they may not fully grasp what they entail or how they are developed.
Consequently, it is essential to delve deeper into the world of HR analytics to comprehend their importance. By doing so, organizations can not only enhance their HR practices but also foster a culture of continuous improvement and accountability. Moreover, as we explore the various metrics available, we will uncover how they can be strategically applied to optimize workforce performance and drive organizational success.
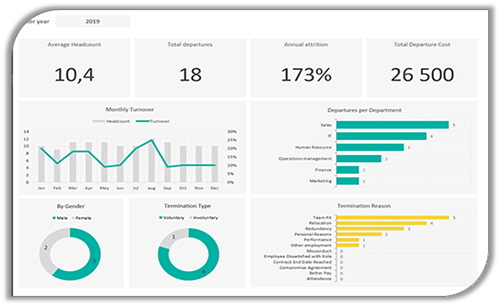
Out of all the metrics, no one can deny that turnover is the most critical metric in an organization. However, this should not be confused with the related but distinct metric known as the attrition rate. Many people use these terms interchangeably, but turnover specifically refers to the number of employees leaving your organization within a certain period of time.
To better understand this important metric, let’s delve into how turnover is calculated. Typically, turnover can be expressed as a percentage, which is derived by dividing the number of employees who leave by the average number of employees during that period. Additionally, it is crucial to consider the reasons behind turnover, as this can provide valuable insights into employee satisfaction and organizational culture.
By analyzing turnover rates, organizations can identify trends and address underlying issues that may contribute to employee departures. Ultimately, understanding and managing turnover effectively can lead to improved retention strategies and a more stable workforce.
(Total termination / Average employee count) * 100
Calculating the efficiency of your recruitment process unveils many insights about the organization, such as its external reputation, internal branding, and the overall quality of hires. One crucial metric in this analysis is the time-to-fill, which measures the duration it takes to fill a specific position.
By examining the time-to-fill metric, organizations can identify potential bottlenecks in their hiring processes. For instance, if positions remain open for extended periods, it may indicate issues in the recruitment strategy or challenges in attracting suitable candidates. Moreover, understanding this metric can help organizations balance the need for swift hiring with the necessity of thorough candidate evaluation.
Consequently, improving the time-to-fill not only enhances operational efficiency but also positively impacts the organization’s ability to maintain productivity and morale. In turn, a streamlined recruitment process contributes to a stronger employer brand, making the organization more attractive to prospective employees.
Sum of all roles’ time to fill / total number of openings filled

Utilizing the time-to-fill metric, organizations can assess whether they are understaffed or overstaffed in relation to the revenue they generate. By analyzing the correlation between staffing levels and revenue performance, companies can identify optimal workforce size for achieving business objectives.
For example, if an organization consistently experiences extended time-to-fill periods and struggles to meet revenue targets, this may indicate an understaffed situation. In this case, hiring additional employees could enhance productivity and improve overall performance. Conversely, if the organization is able to generate substantial revenue with a smaller workforce and experiences quick time-to-fill rates, it may suggest that it is overstaffed. This realization can prompt leadership to reevaluate staffing needs, potentially leading to adjustments that optimize operational efficiency and reduce unnecessary labor costs.
Overall, leveraging the time-to-fill metric alongside revenue data allows organizations to make informed staffing decisions, ensuring they align their workforce with business goals effectively.
Annual revenue / Employee count

Depending on the size of the organization, human resource staff are appointed. By analyzing the ratio of HR staff to employees, organizations can determine whether their HR team is understaffed or overstaffed. A lower ratio indicates that the HR team may be understaffed, which can lead to challenges in effectively managing employee needs and addressing critical HR functions.
For instance, if the HR staff is significantly outnumbered by the employees they support, it may result in slower response times for employee inquiries, a lack of personalized support, and difficulties in managing recruitment, onboarding, and employee engagement initiatives. Consequently, this understaffing can hinder the overall effectiveness of the HR department, impacting employee satisfaction and retention.
On the other hand, a higher ratio may suggest that the HR team is overstaffed, leading to redundancy and unnecessary costs. In such cases, organizations can reassess their HR structure, streamline processes, and potentially reallocate resources to ensure a balanced and effective HR operation.
Overall, by closely monitoring this HR staff-to-employee ratio, organizations can optimize their human resource functions, ensuring they have the right number of personnel to meet the needs of their workforce effectively.
(HR team count / Overall employee count) *100

We know that most employees have a clear understanding of how to navigate the promotion process within their organization. This metric reveals the internal movement regarding promotions and transfers across various functions and specializations. By tracking these movements, organizations can gain valuable insights into employee growth and career development opportunities.
For instance, a high rate of internal promotions may indicate a strong culture of recognizing and nurturing talent, fostering employee loyalty and satisfaction. Conversely, a low rate of promotions could signal potential issues, such as a lack of career advancement opportunities or ineffective succession planning.
Additionally, monitoring transfers within the organization can help identify trends in employee mobility, showcasing how effectively talent is being utilized across different departments. This, in turn, allows organizations to ensure that employees are aligned with roles that best suit their skills and career aspirations.
Ultimately, understanding internal movement metrics not only enhances workforce engagement but also supports strategic planning and resource allocation, ultimately contributing to overall organizational success.
Total promotions / (total transfers + total promotions)
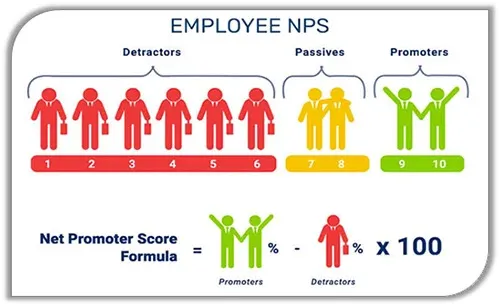
NPS (Net Promoter Score) is widely recognized as a tool for measuring customer satisfaction, and similarly, eNPS (Employee Net Promoter Score) serves to gauge overall employee engagement. By using a scale of 1 to 10, where 1 represents the highest level of satisfaction and 10 indicates the lowest, organizations can collect and analyze responses to understand employee sentiment better.
To effectively interpret the results, organizations can focus on where the majority of responses fall within the scale. For example, if most responses cluster around 1 to 4, it indicates a strong level of employee engagement and satisfaction. Conversely, if responses predominantly hover between 6 and 10, it may signal potential issues in workplace morale or engagement that need to be addressed.
Moreover, tracking eNPS over time allows organizations to identify trends and assess the impact of any initiatives or changes implemented to enhance employee engagement. By regularly measuring and acting upon eNPS, companies can foster a more positive workplace environment, ultimately leading to higher productivity and lower turnover rates. This metric not only reflects employee sentiment but also serves as a vital tool for improving organizational culture and performance.
% Promoter – % detractors
From the above collected metrics, self-analyze your organization and see where you can leverage your organization through the latest human resource management solutions, that comprises end-to-end process include employment visa, employee travel, salary processing, employee devices, employee insurance, employee self-service, employee record management, WPS file generation, Document expiry alerts and even face recognition alerts.
As organizations adapt to the changing workplace, embracing data-driven HR strategies is crucial. By leveraging insights from metrics, companies can make informed decisions that enhance workforce management practices. This approach enables HR teams to pinpoint areas for improvement and align strategies with organizational goals effectively.
Additionally, investing in advanced HR technology can facilitate integrating these metrics into daily operations. For example, a comprehensive HR management system can streamline the collection and analysis of performance data. This makes it easier for HR professionals to track trends and identify issues as they arise.
Moreover, fostering a culture that values data-driven decision-making empowers employees and leaders to take ownership of their roles. This cultural shift encourages collaboration between HR and other departments, ultimately leading to improved organizational performance and employee satisfaction.
Predictive analytics is transforming the HR landscape. It enables organizations to anticipate future workforce trends and challenges. By analyzing historical data and identifying patterns, HR teams can make proactive decisions about hiring, retention, and employee development. For instance, if data reveals a high turnover rate among a specific demographic, HR can implement targeted interventions, such as mentorship programs, to improve retention.
Moreover, predictive analytics allows organizations to forecast future hiring needs based on business growth projections. This ensures that they have the right talent in place when required. Consequently, this forward-thinking approach enables companies to stay ahead of potential issues, fostering a more resilient workforce and enhancing overall organizational performance.
Data can significantly enhance the employee experience by identifying areas for improvement. By regularly collecting feedback through surveys and sentiment analysis, HR can gain insights into employee needs and preferences. For example, if survey results indicate that employees seek more flexible work arrangements, organizations can consider implementing remote work options or flexible hours.
Additionally, these insights can inform initiatives that foster a positive workplace culture, such as recognition programs and team-building activities. Ultimately, prioritizing the employee experience leads to higher retention rates and enhances productivity. Employees who feel valued and supported are more likely to contribute positively to their teams.
Benchmarking HR metrics against industry standards provides organizations with valuable insights. By understanding how their metrics compare, companies can identify areas for improvement and implement best practices from industry leaders. For instance, if a company’s turnover rate is significantly higher than the industry average, it may need to reevaluate its recruitment and onboarding processes.
Furthermore, this comparative analysis serves as a foundation for setting realistic goals. For example, organizations might aim to reduce turnover by a specific percentage within a defined timeframe. Consequently, leveraging benchmarking helps organizations drive performance and cultivate a culture of continuous improvement that benefits the entire workforce.
A data-driven approach to employee development helps organizations tailor their training initiatives. By analyzing performance metrics and employee feedback, HR can identify skill gaps and develop targeted training programs. For example, if data indicates that employees struggle with certain software tools, HR can implement focused training sessions to address these gaps.
Moreover, offering personalized development plans enhances employee engagement and contributes to a skilled, adaptable workforce. Ultimately, investing in employee development fosters loyalty and commitment, leading to lower turnover rates and a stronger organizational culture.
Tracking diversity metrics is essential for organizations committed to an inclusive workplace. By analyzing data related to hiring, promotions, and employee retention across different demographic groups, HR can identify disparities and implement strategies to enhance diversity and inclusion. For instance, if data reveals a lack of representation among leadership positions, organizations can develop targeted recruitment initiatives to attract diverse talent.
Additionally, conducting regular diversity audits helps organizations assess the effectiveness of their inclusion efforts. This focus not only improves organizational culture but also drives innovation and creativity by bringing diverse perspectives to the table. Consequently, fostering diversity leads to a more engaged workforce, crucial for navigating complex business challenges in today’s global marketplace.
Data plays a crucial role in helping organizations evaluate the effectiveness of employee wellness programs on productivity and job satisfaction. By tracking various metrics such as absenteeism, engagement scores, and employee feedback, HR can comprehensively assess the impact of wellness initiatives and make necessary adjustments. For instance, if data shows a notable decrease in absenteeism following the implementation of a wellness program, it strongly indicates success. This reduction not only highlights the effectiveness of the program but also points to potential improvements in employee morale and satisfaction.
Moreover, organizations can analyze employee participation rates in wellness initiatives to identify areas for improvement. By examining who is engaging with these programs, HR can tailor offerings to better meet the diverse needs of their workforce. This analysis ensures that wellness programs are accessible and relevant to all employees, regardless of their backgrounds or circumstances. For example, if certain groups show lower participation, targeted outreach efforts can be developed to encourage involvement and foster inclusivity.
Furthermore, a strong emphasis on employee well-being enhances individual performance and contributes to a healthier, more engaged workforce. When employees feel supported through wellness initiatives, they are more likely to exhibit higher levels of productivity and job satisfaction. Additionally, this investment in employee health can lead to reduced healthcare costs for organizations over time.
Alignment
Article
Audit
Automation
Benefits
Candidate
Communication
Compliance
Digitalisation
Digital Technology
Diversity
Emirates Id Application
Employee Experience
ESS
Feedback
Health and Safety
HRMS
HR Strategy
HR System UAE
Human Resource Management
Human Resource Management Systems
Job Roles
Learning and Development
Onboarding
Outsource
Payroll
Payroll Management System
Payroll Processing
Performance
Performance Management
Personalisation
Recruit
Recruiting
Recruitment
Remote Working
Rewards
Security
Service Providers
Skills
Smart
Survey
Virtual
Visa Cancellation
Work Environment
Workforce
© 2026 Pruvity HR Solutions Pvt Ltd, Madurai, India